Case study
Trinitrade — operating a live trading system as a reliability problem
A production-grade algorithmic-trading platform I designed, built, and ran end-to-end as a single operator — correct, observable, auditable, and cheap to run. The headline isn't profit; it's the engineering discipline, including proving there was no edge and stopping honestly.
Role: sole architect, builder, and operator (SRE / DevOps / quant research).
Stack: AWS · ECS Fargate · RDS/TimescaleDB · CDK (IaC) · GitHub Actions + OIDC + CodeBuild · Grafana · CloudWatch · Alpaca API · Python 3.12 / FastAPI.
1. Executive summary
Trinitrade is a production-grade algorithmic-trading platform I designed, built, and ran end-to-end — from market-data ingestion to live order execution with real capital — as a single operator.
The interesting part is not that it makes money (it doesn’t, and I can prove I was rigorous about that — see §6). The interesting part is that it’s a real reliability problem solved like a senior SRE would solve it: a financial system that must be correct, observable, auditable, and cheap to run, operated safely by one person, with every decision captured in an Architecture Decision Record (ADR).
The core challenge was never latency (this is a low-frequency, daily-signal system, not HFT). The core challenges were:
- Safety — it touches real money, so a bug can’t just be a failed test; it must be contained by design.
- Cost discipline — running 24/7 cloud infra against a tiny capital base inverts the economics, so cost is a first-class engineering constraint.
- Intellectual honesty — proving (or disproving) a trading edge without fooling yourself is harder than building the platform, and it’s the part most people fake.
2. Architecture & infrastructure decisions
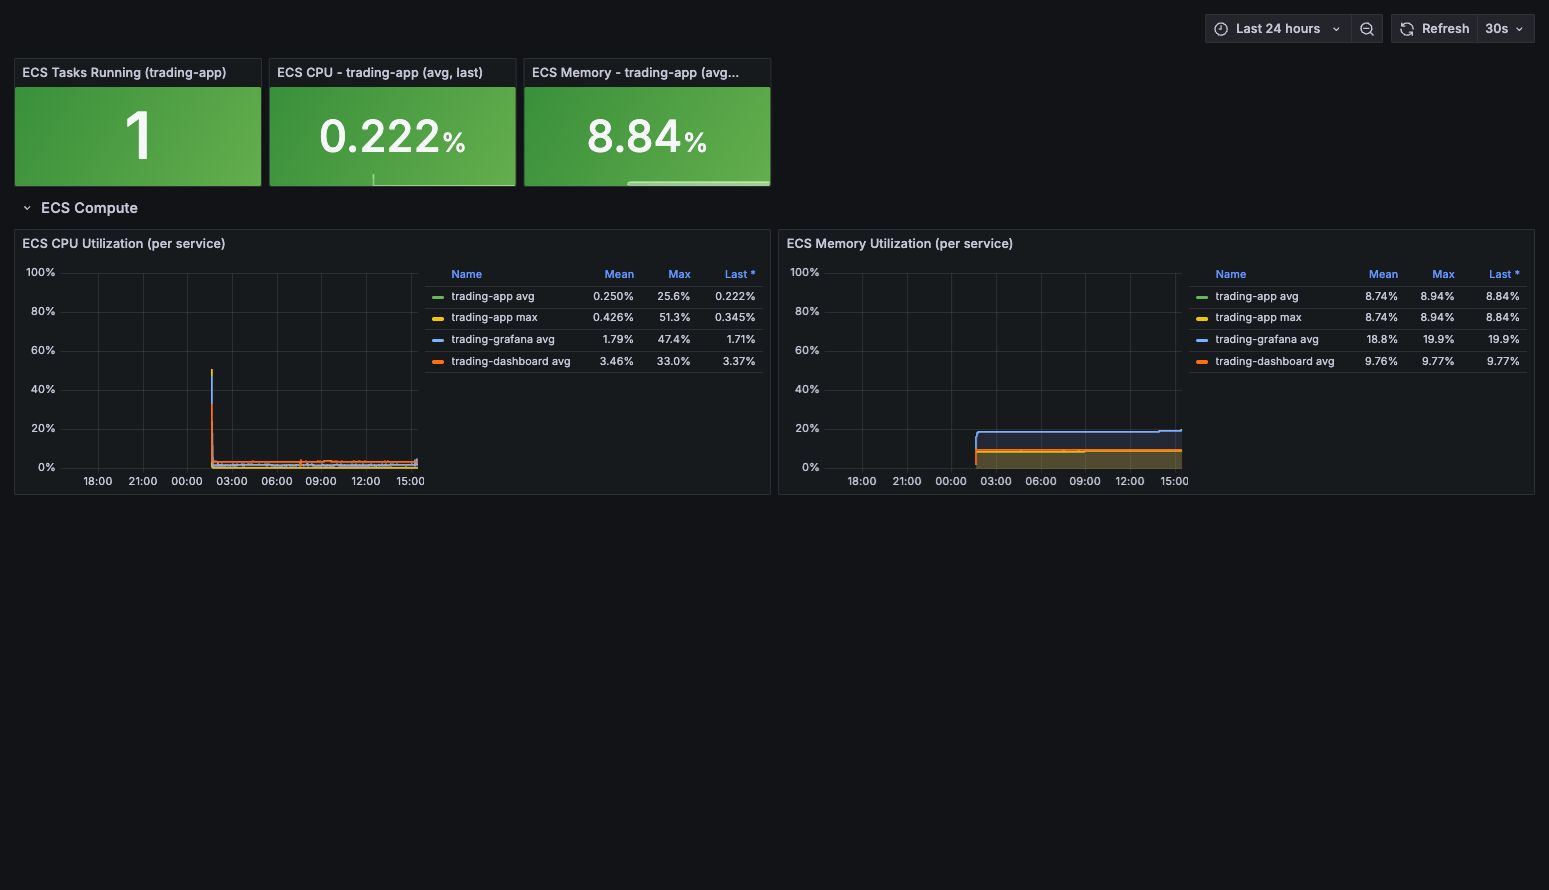
Everything is Infrastructure as Code (AWS CDK, Python) — 19 CloudFormation stacks, zero click-ops. The whole platform can be destroyed and recreated from the repo.

| Decision | What I chose | Why |
|---|---|---|
| Compute | ECS Fargate, single replica, on-demand base + Spot | Serverless containers = no servers to patch. Single replica because order submission must be idempotent and un-duplicated without a distributed lock; a Spot-with-on-demand-base mix keeps cost low while guaranteeing placement during market hours. |
| Execution | Alpaca API (brokerage) | Clean REST/streaming API, paper + live parity, fractional shares — lets a solo operator validate the full money path safely. |
| Region | us-east-1 | Cost and service availability (not latency — this isn’t HFT). Documented honestly as such. |
| Deploy model | Declarative: the live/paper switch, replica count, and feature flags are all CDK context, never out-of-band | Learned the hard way: an out-of-band runtime change is silently reverted by the next cdk deploy. Making everything declarative removed a whole class of “why did prod change?” incidents. |
| Cost-auto-stop | A scheduler scales the service to zero nights/weekends (market closed) and stops the database | The single biggest cost lever. The system is ON only Mon–Fri market hours; off-hours it costs almost nothing. |


On GitHub: compute_stack.py · network_stack.py · scheduler_stack.py · all 9 stacks
3. Data pipeline & storage
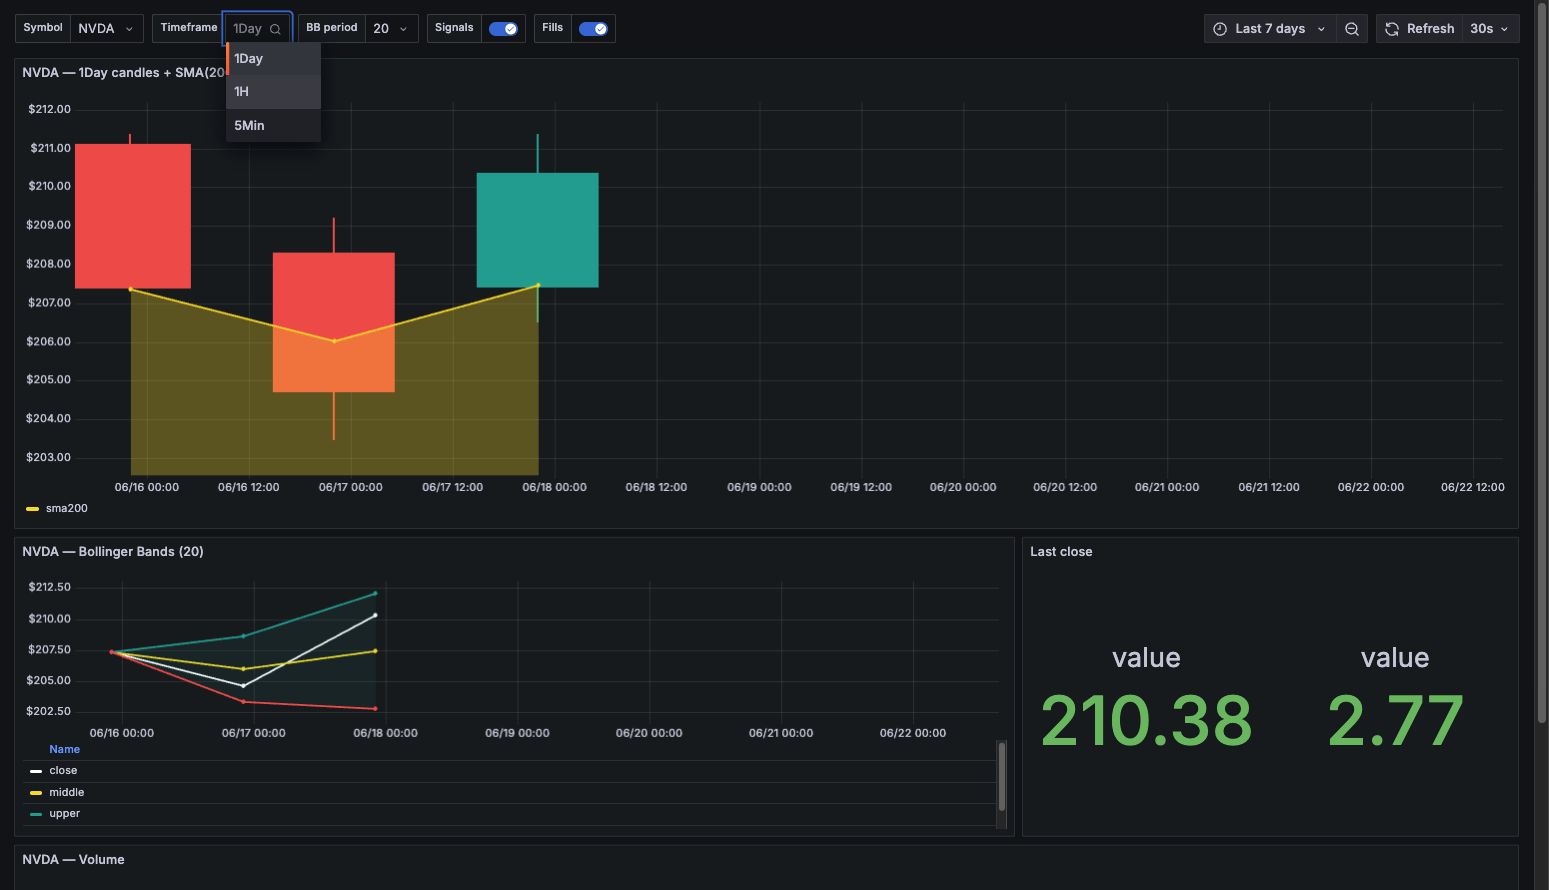
Market data is time-series by nature, so the store is TimescaleDB (a PostgreSQL extension) on RDS.
Why TimescaleDB over the alternatives:
- vs DynamoDB: I need range queries over time + aggregations (OHLCV bars, rolling windows) — that’s relational/SQL territory, not key-value.
- vs plain RDS Postgres: TimescaleDB’s hypertables auto-partition by time and give continuous aggregates, so daily/intraday bars stay fast as the dataset grows, with no manual sharding.
- The research datasets reached ~2,600 daily bars per name across a 736-name survivorship-free S&P 500 panel (2016–2026) — enough that naive table scans would hurt; hypertables kept it boring (which is the goal).
The ingestion path has an integrity guard (e.g. it flags any single-day return < −50% as a likely split/spin-off data artifact) — because in finance, bad data silently produces confident-but-wrong results.
On GitHub: hypertable migration · market_data/service.py · alpaca_provider.py
4. Observability, monitoring & SRE
This is where the system earns the “production-grade” label.
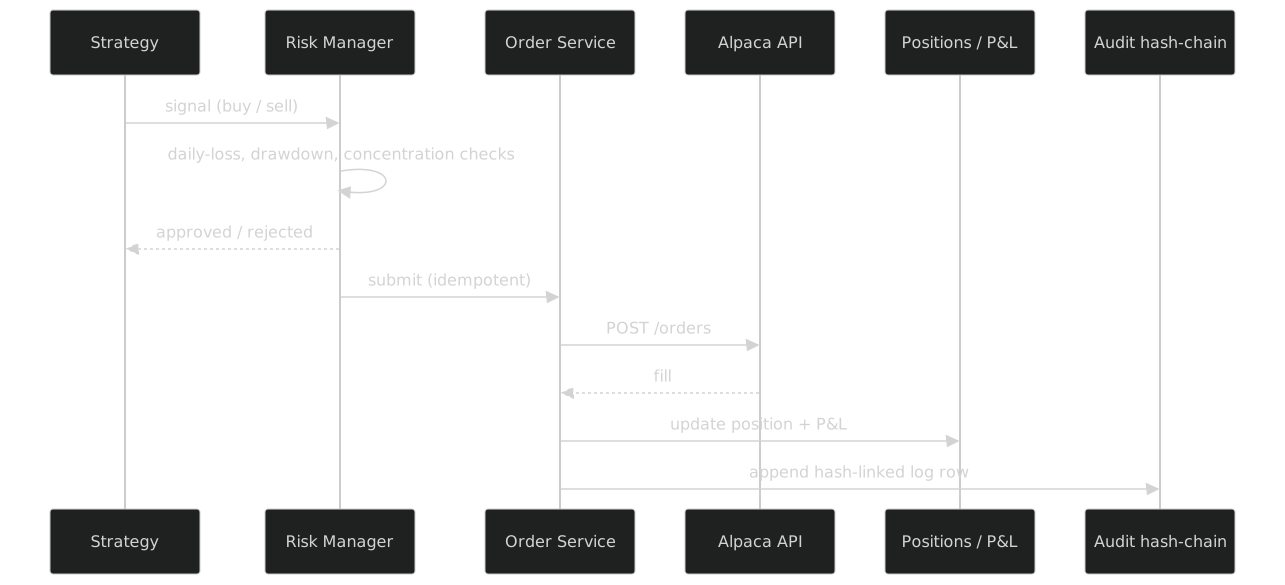
The money path — every signal crosses risk checks before it can touch the broker, and every fill is written to a tamper-evident audit log:
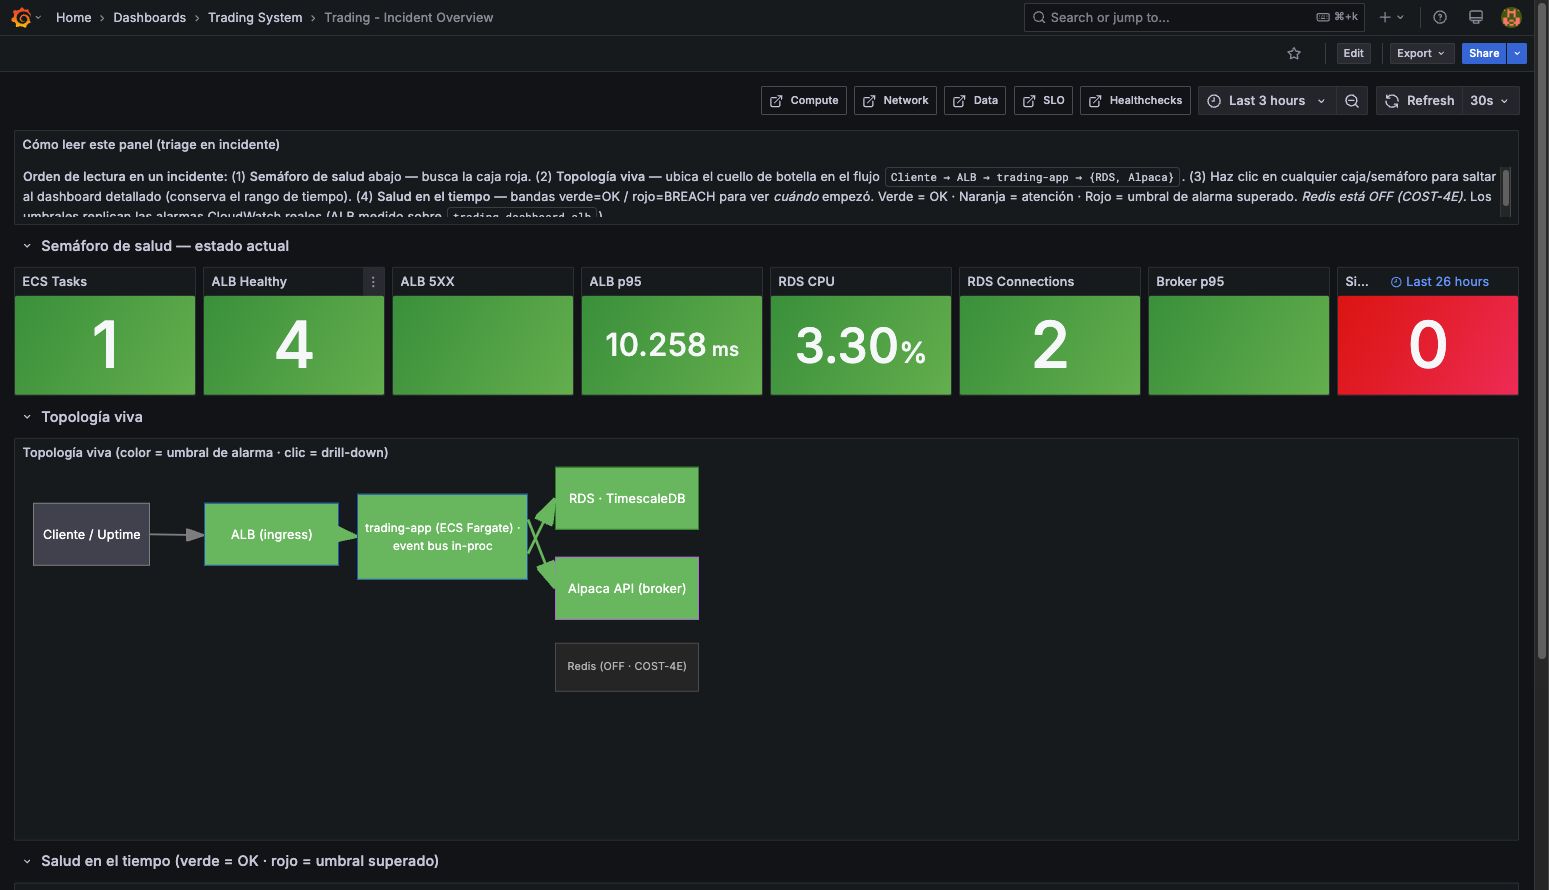
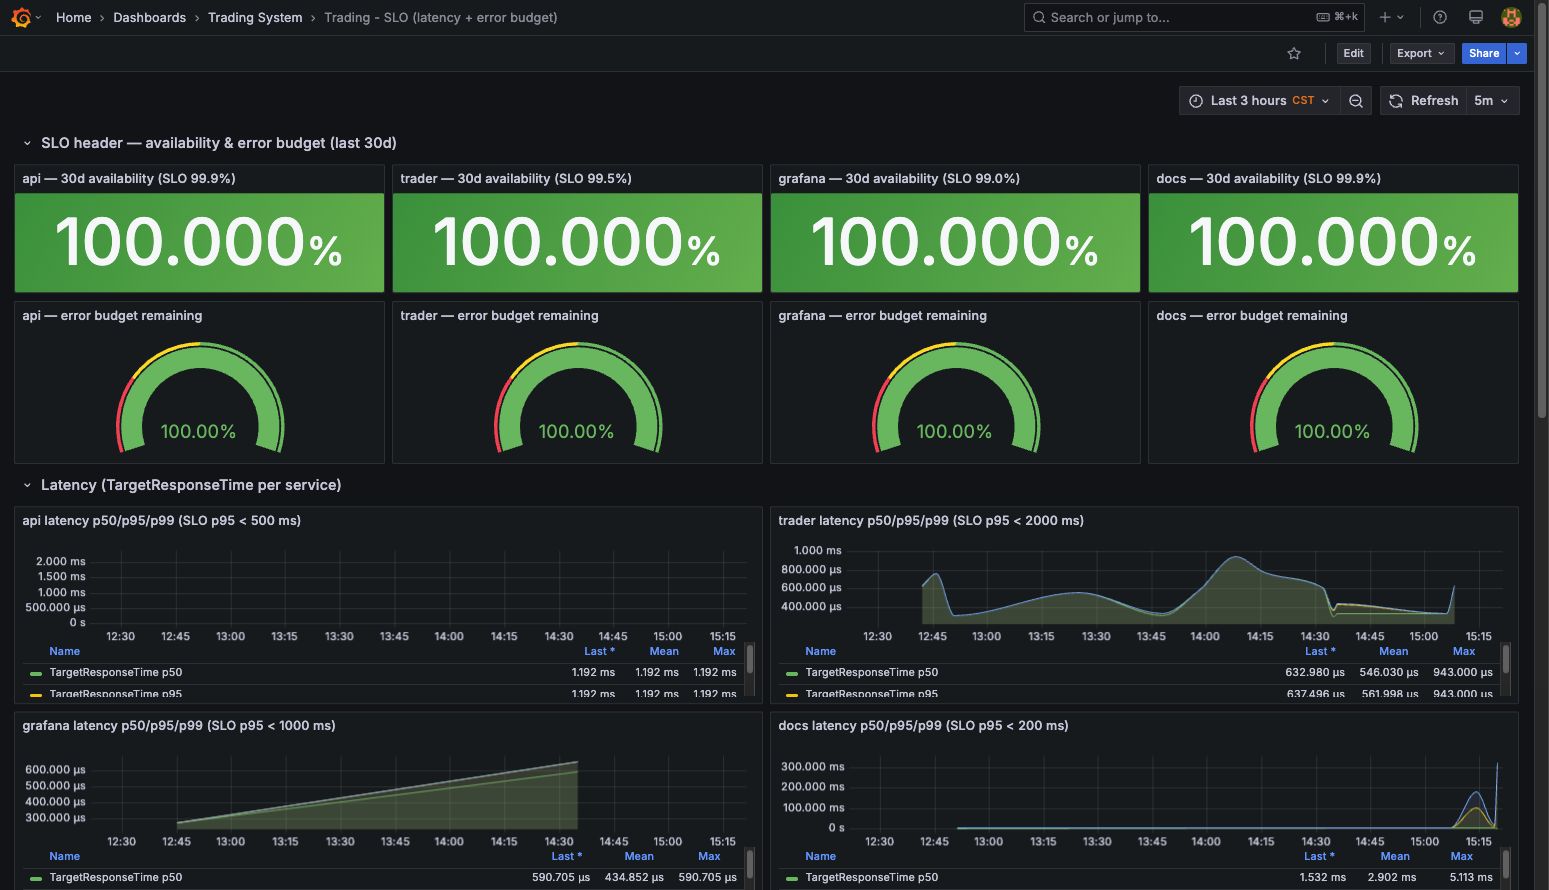
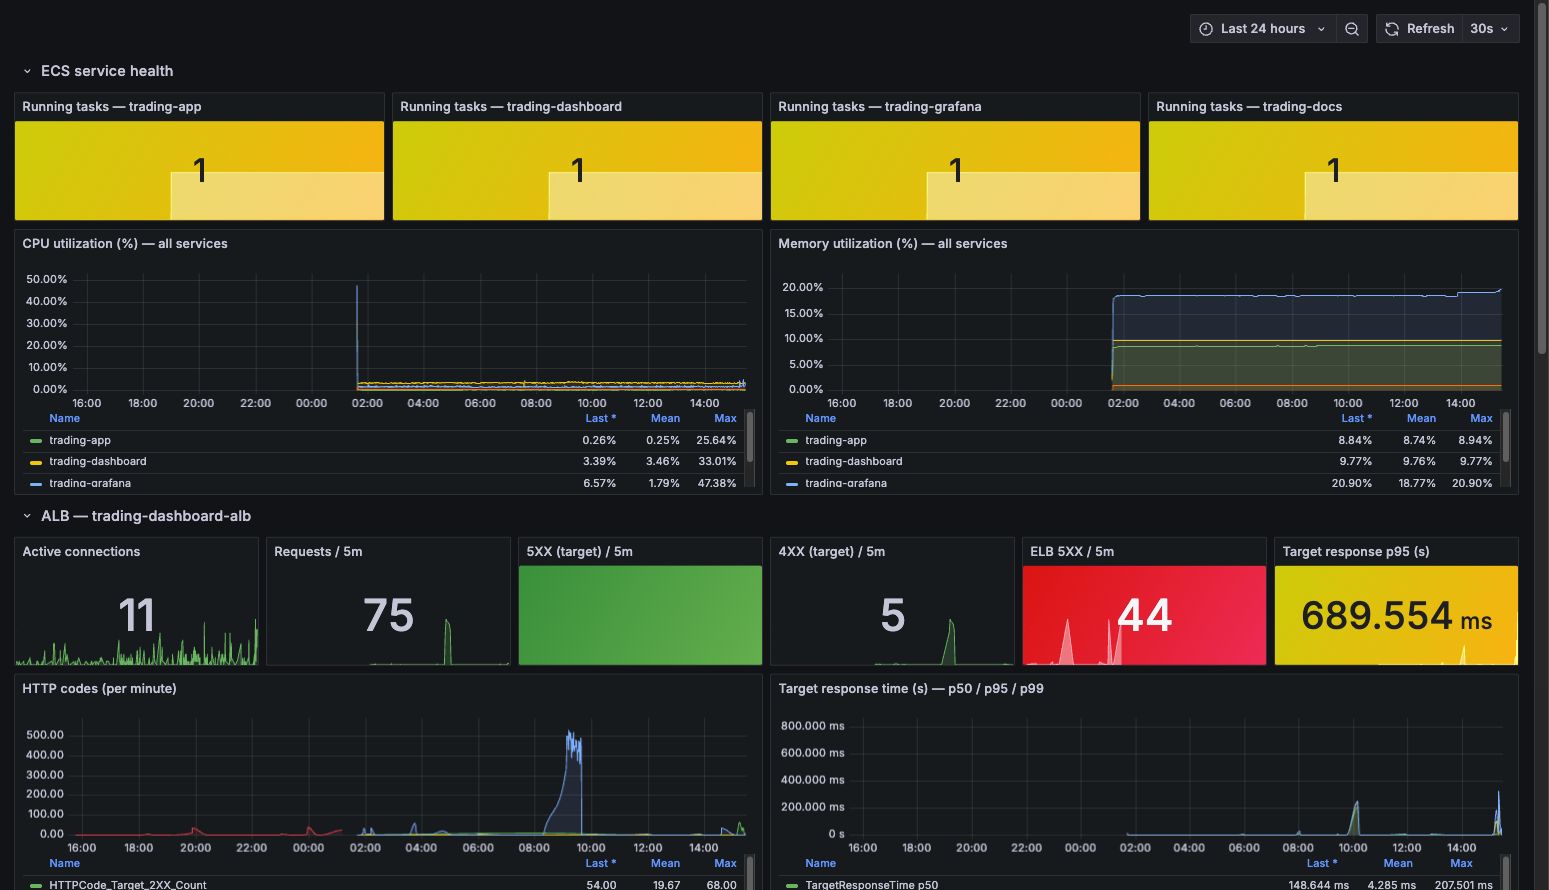
- Grafana: 11 dashboards spanning infrastructure (CPU/memory/running-tasks), the money path (order submission, fills, reconciliation), and SLOs.
- SLOs + alarms: latency/5xx/heartbeat alarms in CloudWatch, with composite alarms gated by off-hours so the system doesn’t page me at 3am for being deliberately switched off.
- Multi-channel alert fan-out: a Lambda fans alarms out to Telegram/Discord — and I treat that delivery path as its own failure surface (the alarm firing and the notification arriving are two different reliability problems).
- Health endpoints split by purpose: a dependency-free liveness probe (fast yes/no for the load balancer) and a deep readiness probe (DB + cache + broker, each wrapped in a 1-second timeout so a probe never hangs).
- Cryptographic audit hash-chain: every trade-log row is hash-linked to the previous one, so the history is tamper-evident — a compliance-grade property, with a scheduled verifier that re-checks the chain and alarms on divergence.


On GitHub: risk_manager.py · order_manager.py · submit_lock.py · audit_service.py · main.py (health probe)
5. Evolution & resilience (real incidents, real fixes)
A few representative reliability lessons (all documented as ADRs/worklogs):
- The silent paper→live revert. A
cdk deployonce reverted the broker mode out-of-band because the switch lived outside CloudFormation. Fix: made the mode declarative CDK context + a durable secret. Lesson: anything not in IaC will drift. - The off-hours deploy trap. Deploying a service stack while the database was stopped (off-hours) trips the deployment circuit-breaker into
UPDATE_ROLLBACK. Fix: a hard rule — never deploy a stateful service stack outside its ON window — encoded in the runbook. - A concurrency bug in the audit chain. Concurrent writers produced hash-chain divergences; fixed with a Postgres advisory lock so the chain is serialized. Lesson: “append-only + hash-linked” still needs a lock.
- Shell portability in CI. A
${PIPESTATUS[0]}bashism silently failed every build under/bin/sh(dash), masking the real result. Fix: explicitbash -c 'set -o pipefail; …'. Lesson: CI runs in the shell it runs in, not the one you assume.

On GitHub: Dockerfile (multi-stage, non-root) · entrypoint.sh
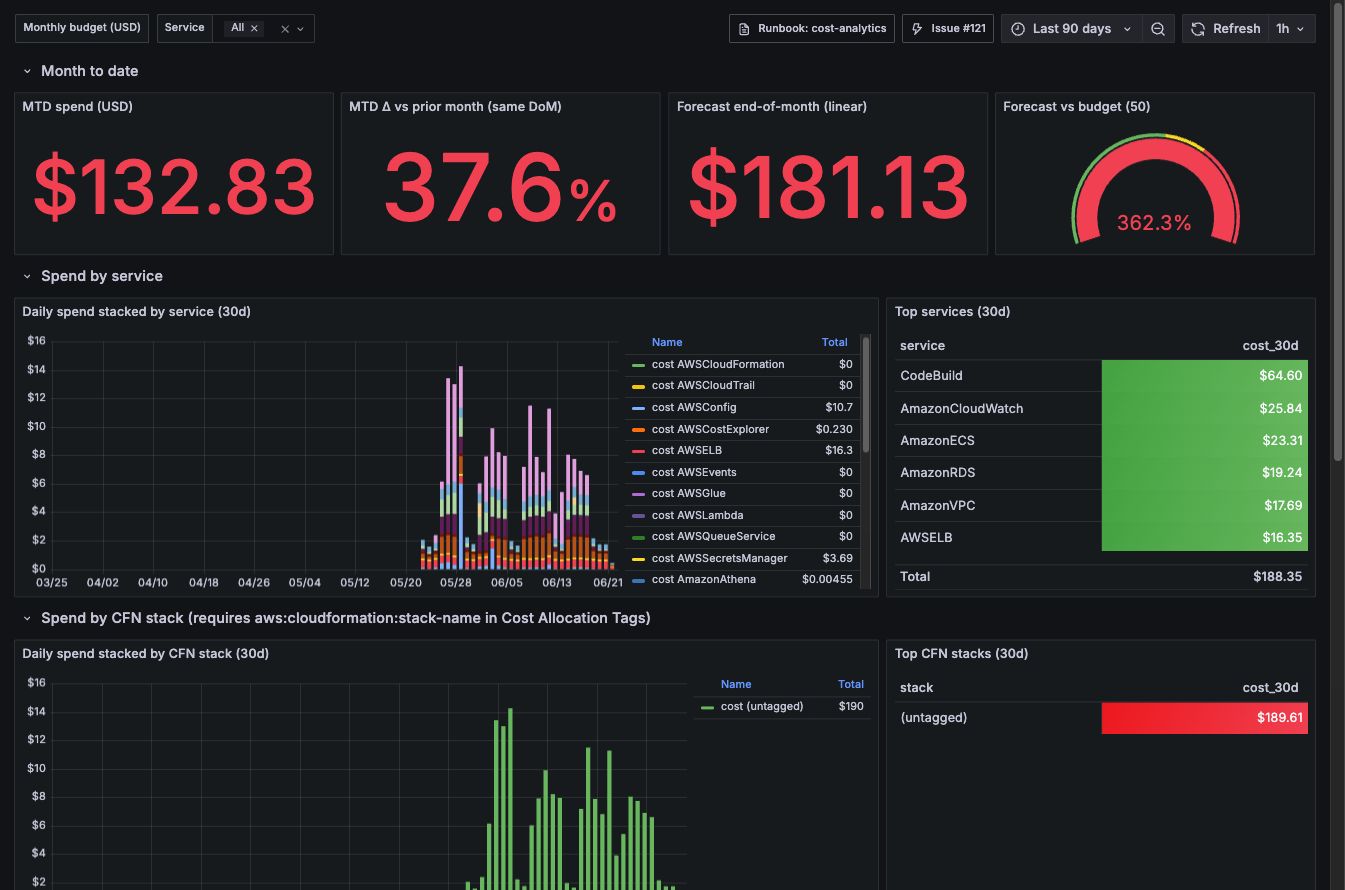
Cost was engineered down continuously: the CI pipeline was consolidated (11 → 7 jobs), an unused cache tier was removed, and a full AWS Cost Explorer audit drove a structured cost-reduction plan — treating the monthly bill as an SLO of its own.
6. The part most portfolios hide: I proved there was no edge — and stopped
This is the section I’m proudest of, and the one that should matter most to a hiring panel.

I ran a pre-registered, multiple-comparisons-aware research program to find a genuine trading edge:
- 7 distinct strategy families across two programs (trend, volatility-targeting, dual-momentum, cross-sectional momentum, cross-asset time-series momentum, mean-reversion/pairs, and event-driven/PEAD).
- Discipline: every hypothesis was frozen in a git commit before it ran (so the rules couldn’t be moved after seeing results), with pre-stated acceptance criteria and a stop-rule (a fixed attempt budget — you don’t run hypotheses until one wins by luck).
- Bias controls: survivorship-free point-in-time data, look-ahead guards, and explicit tests that distinguish a real signal from a statistical mirage.
The result: all 7 families were NO-GO vs simply holding the market (passive SPY). One looked promising — a post-earnings-drift signal with a very high statistical significance (t ≈ 5.7) — until a $0 control test showed the “edge” was just market beta in disguise, not harvestable alpha. So I concluded the program with a capstone decision and stopped, rather than curve-fitting a loser into a false win.
Why this matters for an SRE/Lead role: the same discipline that stops me from p-hacking a backtest is the discipline that stops me from shipping a “probably fine” change to production. Measuring honestly and stopping on the evidence is the senior skill. A clean, well-documented negative is a success of method.
Decisions across the project are documented as Architecture Decision Records (27 of them) — including the decision to stop. The sanitized source, infrastructure stacks, all architecture diagrams, and more evidence live in the public repository.